QuantiScan 光密度分析軟體
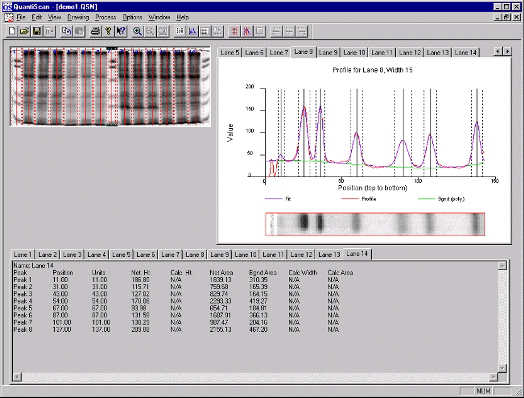
 QuantiScan for Windows has similar functionality to sophisticated densitometers but at a fraction of the cost. It is able to analyze a wide variety of material including polyacrylamide and agarose gels, autoradiograms, TLC plates, etc. The program will accept images for analysis directly from any TWAIN compliant scanner as well as most BMP, JPG or uncompressed TIF files. For laned gels of reasonable quality, the analysis is highly automated, allowing extremely high throughput of data. Almost any type of image can be analyzed with the manual modes of Quantiscan. Images can be pre-processed in a variety of ways within QuantiScan including crop, flip, invert, scroll and zoom.
Numeric, graphical and image output can be printed as reports and can also be saved as files or copied to the clipboard. The X,Y coordinates of densitometric profiles can output into a tabbed table for re-plotting in presentation graphics software such as Biosoft's FigSys. There is a separate module for analysis of discrete blots which can also be operated with automatic or manual blot detection.
Lane Analysis Mode
There is sophisticated lane processing and analysis for gels. Lanes of any width can be created manually or by using the unique automatic lane detection mode. There is also a facility to automatically set lanes at regular intervals for use with plates that have a preconfigured regular lane array. Lanes can be skewed or curved to allow for gel imperfections. Lane boundaries can be copied and the copies moved precisely into position with the cursor keys, for exact comparisons. Each lane can be labelled with an unique number both on its image and its densitometric profile plot. There are six options for automatic background subtraction: Minimum, Interpolated minimum, Valley, Edge, Polynomial and Manual. User-selected areas of images can be displayed as 3-D density maps which can be printed, saved or copied to the clipboard.
Once a lane has been defined, its densitometric profile plot is automatically drawn. Peaks can then be specified on the profile either manually by marking their center and edges, or automatically using a sophisticated peak search routine. Where appropriate, automatic fitting of Gaussian peaks can be performed. This automatic fitting uses a least-squares minimization technique to fit a sequence of peaks and a polynomial background to the given profile. The image of the currently-selected lane is shown laid-out horizontally under the lane densitometry profile. A cursor-controlled vertical line going across the profile and the lane image aids user examination of the peaks. The image and profile of a standard lane can be added for comparison with the first. Their alignment can be adjusted to aid accurate side-by-side comparisons. Peak areas are calculated by integration using Simpson's rule and, if the automatic fitting option has been used, the area of the fitted peak is also automatically calculated.
Calibration to a lane containing standard proteins may be made for automatic calculation of molecular weights. Calibration can also be made with a known standard solution such as those supplied with assay kits (just enter the position of its start line, its mol. wt. factor and the position of the solvent front, to give automatic calculation of mol. wts of unknowns). Parameters of any standard lane can be saved for between-plate comparisons. Calibration curve graphs and their fitted coordinates can be exported. Reports are generated for all peak parameters, including position, height, width, background and net area of peaks and, together with the graphical results, these can be printed, saved to disk or copied to the clipboard for transfer to other programs.
Blot Analysis Mode
QuantiScan offers a separate mode to analyze discrete blots. The blots can be automatically detected or manually defined. Their number, position, height, area and densitometric volume are automatically reported. There is a special module for automatic analysis of regularly arrayed blots. Automatic background subtraction is an option. Calibration, based on densitometric volume of standard blots can be done and this allows blot mode to be used for assays.


