


Primer7 生態學多變數統計軟體

For a list of changes to previous version:
- Robust, widely applicable, statistical analysis of multivariate data, e.g. species assemblages, physico-chemical variables, genetic, microbial, biomarker, diet, RS, modelling etc data.
- A ‘standard’ for marine community & biodiversity research, increasingly used in terrestrial, freshwater & palaeo studies. Also widely used commercially for assessing environmental impacts of oilfields, discharges, mining, trawling, aquaculture.
- The methods make few, if any, assumptions about the form of the data ('non-metric' ordination and permutation tests are fundamental to the approach) and concentrate on approaches that are straightforward to understand and explain.
The statistical methods underlying the software are explained in non-mathematical terms in an extensive 'methods manual', which also shows outcomes from many literature studies, e.g. of environmental effects of oil spills, drilling mud disposal, sewage pollution etc on soft-sediment benthic assemblages, disturbance or climatic effects on coral reef composition or fish communities, more fundamental biodiversity and community ecology patterns, mesocosm studies with multi-species outcomes etc. Many of these full data sets are included with the package so that the user can replicate the analyses given in the manual for himself/herself.
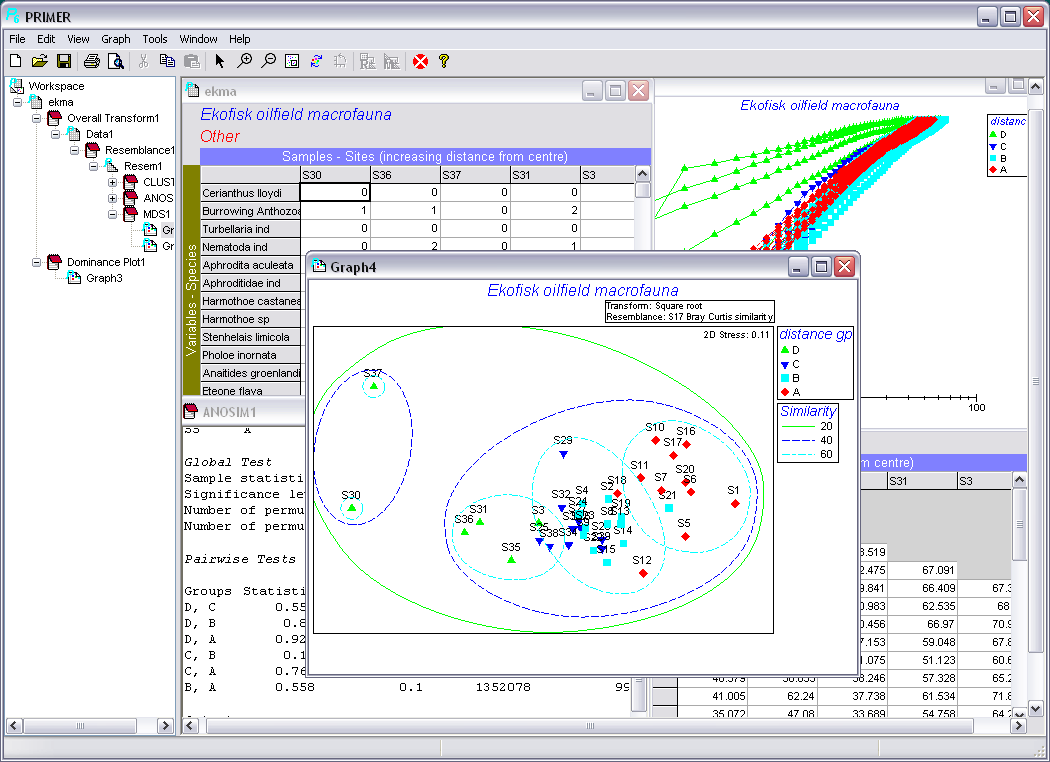
The full integration within a standard Windows environment allows: easy manipulation of data and results, e.g. in input/output from Excel spreadsheets or other sources; the ability to view and manipulate data and some derived files/plots on screen, in multiple windows; standard Windows printing and export to Windows .emf or .bmp files (graphics) and .rtf files (text); flexibility in specifying analyses, particularly for subsets of data and in defining group structures for tests and displays; ability to handle relatively large data sets (subject to available Windows memory and, primarily, time constraints - as with all non-parametric and permutation-based methods, computation time can b
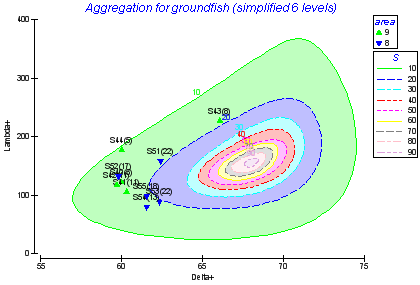
A further unique feature of PRIMER 6 is the ability to calculate biodiversity indices based on the taxonomic distinctness or relatedness of the species making up a quantitative sample or species list, indices whose statistical properties are robust to variations in sampling effort. These routines allow formal hypothesis tests for change in biodiversity structure at a location (as measured by average and variation in taxonomic 'breadth' of the species list), from that 'expected' from a larger, regional species pool. It provides a possible way of comparing biodiversity patterns over wide space and time scales, when sampling effort is not controlled.
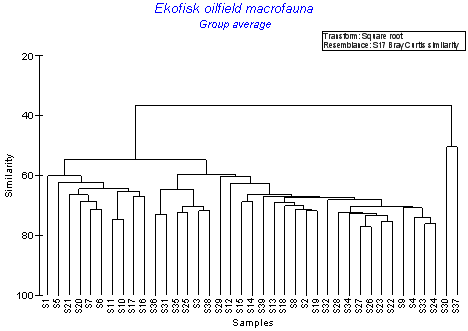
CLUSTER
Hierarchical clustering into sample (or species) groups. Rotate, collapse, zoom plots, multi-page printout
MDS & PCA
Ordination by non-metric multidimensional scaling (MDS) and principal components (PCA). Overlay clusters, trajectories, bubble plots.
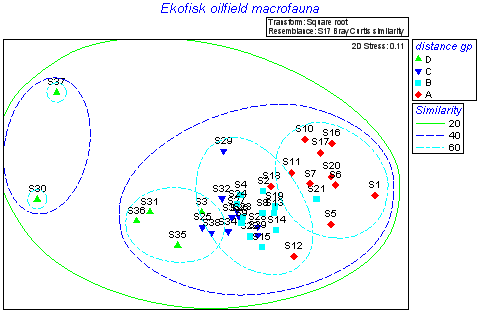
ANOSIM
To summarise patterns in species composition and environmental variables; permutation-based hypothesis testing (ANOSIM), an analogue of univariate ANOVA which tests for differences between groups of (multivariate) samples from different times, locations, experimental treatments etc.
SIMPER
Identifies the species primarily providing the discrimination between two observed sample clusters.
BEST
The linking of multivariate biotic patterns to suites of environmental variables. Includes permutation tests.
RELATE
Comparative (Mantel-type) tests on similarity matrices.
TAXDTEST
Taxonomic distinctness tests.
Other
Standard diversity indices; dominance plots; species abundance distributions; aggregation of arrays to allow data analysis at higher taxonomic levels, etc.