Data Desk 8.1 資料統計分析軟體
Data Desk 8.1
數據分析是部分探索和部分直覺。隨著數據集的不斷增長,圖形化實時數據分析變得前所未有的重要。Data Desk是一個經過時間考驗的工業,研究和教育工具。它不僅提供了理解一個數據所需的工具,還提供了更一般地理解統計數據的方法。憑藉世界一流的文檔和多年的數據可視化開發,Data Desk是一個理解的平台。
Data Desk 8.1是一個令人興奮的更新,適用於所有帶來全新功能的Data Desk 8用戶。
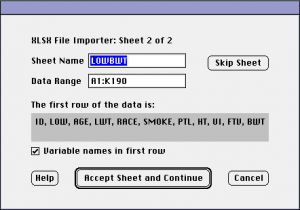
XLSX導入通過Data Desk分析將您的日常數據透視。自動導入關係,並使用導入嚮導命名變量。
新的更新檢查可讓您及時了解最新的錯誤修復和增強功能。這將以更頻繁和漸進的方式提供更新的功能。
以新的方式看待事物
通過允許用戶以不同方式快速重新表達數據,Data Desk鼓勵實驗和組合創建更具吸引力的模型。實時選擇不同可視化中的數據並對其進行分類
獲得更多的視角
真實世界的數據難以使用。除了最微不足道的案例之外,盲目地將公式應用於數據幾乎沒有價值。Data Desk允許人們退後一步并快速瀏覽數據。比以往更快地發現異常值和趨勢。

你的圓形圖和圖表也是如此
多年的工程設計使Data Desk成為同類最佳速度和拖放簡單性之間的最佳選擇。使用我們高度優化的引擎,大數據集無法理解。

For the Fastest Visual Exploration and Analysis, the Deepest Insight
Data Desk brings fast, easy-to-use visual analysis to your desktop. It provides interactive graphical tools for exploring and understanding your data—for finding the patterns, relationships, and exceptions. While it implements many traditional statistics techniques suitable for data from planned experiments and sample surveys, Data Desk’s true strength is its powerful tools for data exploration. Its insightful graphic displays simplify intuitive investigation of your data.
You Don’t Need a Statistics Background
No special training in statistics is necessary to gain insight on the implications of the data you need to understand. You’ll find patterns and relationships, and you’ll bring to light the elements that don’t fit—of the most important discoveries you can make. You’ll get to the real causes behind the patterns and relationships.
See Your Data Many Ways at Once
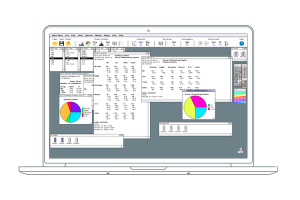
Extreme computational speed and linked views make Data Desk an unsurpassable tool for exploring any set of data—from a few hundred cases to a few million. You’ll see several different views of your data at once. Select points in one plot or table and see those points highlight instantly in all other plots. Modify a data value or parameter and see all relevant plots and table update immediately. Start at one level and drill down for more detailed views.


